Basically, 5 points (1 win, 2 draws) means you're almost guaranteed to get out of the group, while 4 points (1 win, 1 draw) means you have around a 50-50 shot.
So...now I know! And so do you!
Posts with mood geeky (19)
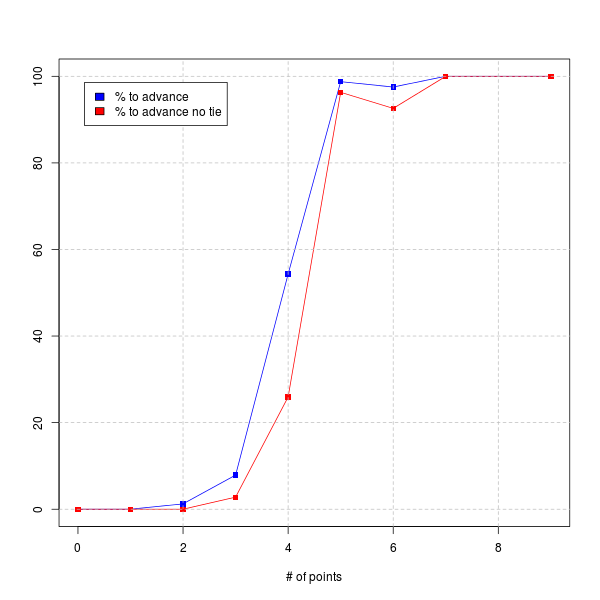
World Cup: how many points do you need to advance?
Mood: geeky
Posted on 2013-12-08 21:45:00
Tags: soccer math
Words: 84
After the USA was drawn into the "Group of Death", I wondered how many points the USA would need to be relatively assured of making it out of the group. So I wrote a little Python script to do the calculation, and the answer is below:
Basically, 5 points (1 win, 2 draws) means you're almost guaranteed to get out of the group, while 4 points (1 win, 1 draw) means you have around a 50-50 shot.
So...now I know! And so do you!
Adventures in math: finding a red dot in a book, Marilyn vos Savant is wrong!
Mood: geeky
Posted on 2013-05-05 11:43:00
Tags: math
Words: 567
Let's consider the following problem, which is based on reality and caused a 15 minute argument lately: You're given a book and told it has a 90% chance of having one red dot in it (and a 10% chance of having no red dot). If you read the first half of the book and don't find a red dot, what is the probability the red dot is in the second half of the book?
To join in our argument, your choices are 90% or something less than 90%.
My stance (which I think is correct!) was that the chances go down the more you read. There are two equivalent ways to think about this:
- Assuming the location of the red dot is distributed uniformly throughout the book, before you start reading the book the chances that the red dot is in the first half of the book are 45%, in the second half 45%, and not at all is 10%. Once you know it's not in the first half of the book you can eliminate that first 45% chance, so the chances it's in the second half are (.45)/(.45+.1) = .45/.55, or around 82%.
- You can formalize this by using Bayes' theorem. Let's set up our events:
A = red dot is in book
B = red dot is not in first half of book
So the probability we want is P(A|B). (meaning the probability that A is true given that B is true)
Some values we're going to need:
P(A) = .9
P(B|A) = .5 (this is where the assumption that the distribution of the red dot is uniform comes in)
P(B|not A) = 1 (if the red dot isn't in the book, it's not in the first half!)
P(B) = P(B|A)*P(A) + P(B|not A)*P(not A)
= .5*.9 + 1*.1
= .55
So, by Bayes' theorem, P(A|B) = (P(B|A) * P(A))/(P(B)) = .5*.9/.55=.45/.55, which is the same result as we got above. You can see that Bayes' theorem is really just formalizing the logic we were using in the first case!
You can generalize this - if the red dot isn't in the first x of the book (for x between 0 and 1), then P(B|A) = 1 - x, and we end up with
((1-x)*.9)/((1-x)*.9 + .1)
So for x = 0 this is .9, as we expect (since we haven't read anything) and for x = 1 this is 0 (since we know it's not in the book). And here's the Wolfram Alpha plot of the function!
--
I was reading Parade this morning, and Marilyn Vos Savant's column had a math problem, which made me say goody! Here's the column. Unfortunately her answer is wrong. The problem with counting the combinations this way is that we're overcounting some of them. In her example, 5 is the number that you know is in the combination, and in step 1 we count the numbers 5000-5999. But then in the next step we count 0500-9599, keeping the 5 constant, and this double counts the numbers from 5500-5599. Similarly the third and fourth steps overcount, and the combination 5555 is counted four times!
The correct way to do this problem in the general case is to use the Inclusion-exclusion principle, but an even easier way is to read "at least one 5" as "everything except no 5's". So there are 10^4 total combinations, and 9^4 of them have no 5's, so the number of combinations that have at least one 5 is 10^4-9^4=3439, significantly less than 4000.
More Windows Phone impressions
Mood: geeky
Posted on 2011-12-24 22:28:00
Tags: windowsphone
Words: 532
I've spent a few more days playing around with Windows Phone 7, so here are more impressions comparing it to my Palm Pre:
- The Pre has a physical keyboard (and no virtual one), so I wasn't sure how I'd adapt. The virtual keyboard on the Focus S isn't as good as a physical one, but it's pretty good, and I'm impressed with the predictive text. It's also nice to always have the keyboard available - on the Pre it was a bit of a mental hurdle to slide it out.
- Live tiles are nice, but they serve two distinct purposes. One is for commonly used apps: aside from live tiles, all you get are all apps (minus games; see below) in a big alphabetical list, although there is an easy way to jump to a particular letter. The other is a replacement for notifications: you can "pin" various pieces of data (like, say, flights you're tracking!) and they can be updated by background apps. I wish there was a way to organize tiles better, and maybe a way to see apps in most recently downloaded order.
- You can't bookmark apps in the marketplace in case you see one to buy later. That makes me sad.
- It's nice that there's a common framework for making trial apps (and as a developer you can limit it however you want), and you can upgrade by buying the full version without having to redownload. But there doesn't seem to be a standard way to get from the trial app to the Marketplace to buy it, and most trial apps don't even have a button in the app to upgrade?? Maybe I'm missing something?
- Pretty sure this is a hardware issue, but the light sensor on this Focus S is a bit wonky; sometimes the screen brightness flickers lighter and darker.
- The People hub is a nice aggregation of Facebook and Twitter.
- On my Pre, I'm used to opening my Twitter client, tapping any links that look interesting (which opens them in separate cards), then reading them one by one. This is harder now, since to emulate it I have to click a link, and then press the back button, and hope all my tabs stay around. And it means I have to set all links to open in new tabs, so I have to remember to close each one when I'm done with it, which I've forgotten multiple times.
- Having an "accent color" that you can change (with lots of good options!) is cool. Most built in apps use the current accent color as a background on their icon, so it really changes the look of the phone. (it also means I have to decide whether to use the accent color background for my apps or not...jury's still out on that)
- The way Windows Phone does "multitasking" is by making a long press on the back button show recently used apps that are still in memory and can restore themselves to their previous state. This works well enough for, say, switching to PasswordHash, generating a password, and switching back to IE. It can take a few seconds to restore state, which is a bit of a bummer
Samsung Focus S w/ Windows Phone 7 - initial thoughts
Mood: geeky
Posted on 2011-12-21 15:01:00
Tags: windowsphone
Words: 178
Last night my Windows Phone developer device came in (thanks, Jared!) - it turned out to be a Samsung Focus S. I was initially a little disappointed that I didn't get a Nokia Lumia phone, but I was still eager to play around with Windows Phone on a real device.
(some of my impressions are probably colored by the fact that my main phone is still an original Sprint Palm Pre, which is a bit long in the tooth...)
Even so, this phone is quite nice. Setup was painless, and I like the fact that I didn't have to jump through any extra hoops to use it without a SIM card.
The screen looks quite nice - even though the resolution's only 800x480. Scrolling is very, very smooth.
I'm liking the whole live tile home screen thing, although I'm looking for more apps that have interesting/fun live tiles.
Anyway, point is I'm quite happy with the phone/OS, and I'm looking forward to getting one of my own! Hopefully tonight I'll get a chance to try my apps out on it...
German math problem
Mood: geeky
Posted on 2010-11-20 23:39:00
Tags: math
Words: 992
As I mentioned during the Germany trip recap, visiting Allianz Arena inspired a math problem. Here it is!
Allianz Arena is home to two German soccer teams - Bayern München (hereafter "B") and TSV 1860 München (hereafter "T"). Let's assume there are 2n weeks in the season, and one game per week, and half a team's games are at home and half on the road. Presumably B and T would have to work out who gets to play at home which week, but let's say they didn't and just randomly picked which weeks they play where. What is the expected value of the number of "conflict weeks" - i.e. both B and T are scheduled to play at home?
My first step was to try this out with n=1. Then you get the following possibilities (here I just show just the weeks the team plays at home):
Week 1 TB T B
Week 2 B T TB
# conflicts 1 0 0 1
So the expected value of the number of conflicts is .5 for n=1.
Now, I took a guess at what the expected value was in general. As a rough guess, each team has to choose n weeks, so you might expected about half of them to overlap. But it seemed to me that once you do have a conflict week, the chances of another one would go down (since you've "used up" one game from both teams), so I thought it might be a bit less than n/2.
So - onwards to discovering the answer! It seemed fairly easy to write this out as a recurrence relation with the following parameters:
c(w,b,t) = expected number of conflict weeks if there are w weeks in the season, b home games for B left, t home games for T left.
Base cases: c(w,b,0) = c(w,0,t) = 0 [no games left for one team means no conflicts]
c(w,w,t) = t and c(w,b,w) = b [if one team has to play all their games in the remaining weeks, however many the other team has left is the number of conflicts]
And we write the induction step by looking at the first week:
c(w,b,t) for 0 < b,t < w is:
(w-b)/w * (w-t)/w * c(w-1,b,t) [chance that b and t don't play a game this week times what happens for the rest of the season]
+ b/w * (w-t)/w * c(w-1,b-1,t) [chance b plays a game this week and t doesn't]
+ (w-b)/w * t/w * c(w-1,b,t-1) [chance t plays a game this week and b doesn't]
+ b/w * t/w * (1 + c(w-1,b-1,t-1)) [chance both play a game this week, so the expected value goes up by 1]
This looked correct, but was a little discouraging because it seemed very not obvious what an explicit formula would be. But it was easy enough to code a quick Python script to get a hint to what an answer would be.
The results were highly suggestive: c(2,1,1) = .5 (this is the case we worked out by hand above), c(4,2,2) = 1, c(6,3,3) = 1.5, c(8,4,4) = 2, c(10,5,5) = 2.5, etc. So it sure looked like c(2n,n,n)=n/2.
But I really wanted to prove it, but dealing with this kinda ugly recurrence relation didn't seem like the way to go. Also, this seemed like a combinatorial problem and it seemed like there should be a nice combinatorial way to express c(2n,n,n).
After some thought I came up with a good way of thinking about it. Let's say without loss of generality that B's home games are the first n of the season. Then you're just choosing T's home games and seeing how many overlap with the first n. This leads fairly naturally to the explicit formula:
c(2n,n,n) = (sum_{i=0}^n [(n choose i) * (n choose (n-i)) * i])/(2n choose n)
Here i represents the number of conflicts, and the chance of getting that many conflicts is the same as choosing i games in the first n weeks of the season (which will be conflicts), and the remaining n-i in the second n weeks of the season. In total, you're choosing n weeks out of 2n, which is where we get the denominator from.
This didn't seem like a huge improvement at first, but we can actually simplify this a lot. First of all, (n choose i) = (n choose (n-i)), so we get
c(2n,n,n) = (sum_{i=0}^n [(n choose i)^2 * i])/(2n choose n)
Now, notice that (sum_{i=0}^n [(n choose i)^2]) = (2n choose n)). The right side is the number of ways of counting choosing n objects out of 2n choices, and the left side is the same - first you choose which i are in the first half, and then which (n-i) are in the second half (since (n choose i)=(n choose (n-i)). So this will help out in a minute.
Now let's consider two cases:
Case 1: n is odd, i.e. n=2k+1 for some integer k.
Let's just look at the numerator of c(2n,n,n) and split it up in half to get
sum_{i=0}^k [(n choose i)^2 * i] + sum_{j=k+1}^n [(n choose j)^2 * j]
Here we can pair up i's and j's that sum to n - since 0+n=n and k+(k+1)=2k+1=n, this covers all of them. Since i+j=n, then (n choose i)=(n choose j), so we'll end up with
sum_{i=0}^k [(n choose i)^2 * i + (n choose i)^2 * (n-i)], or
sum_{i=0}^k [(n choose i)^2 * n]
Now we can unsplit this back into the i's and j's, giving n/2 to each side to get
sum_{i=0}^k [(n choose i)^2 * (n/2)] + sum_{j=k+1}^n [(n choose j)^2 * (n/2)]
which simplifies down to
sum_{i=0}^n [(n choose i)^2 * (n/2)]
(n/2) * sum_{i=0}^n [(n choose i)^2]
Since we showed above that this sum is equal to (2n choose n), this means that
c(2n,n,n) = ((n/2) * (2n choose n))/(2n choose n) = n/2, as desired!
Case 2: n is even, i.e. n=2k for some integer k.
This is the same as the previous case, except we have the additional value i=k which doesn't pair up with anything. But, the value that we're summing for i=k is ((n choose k)^2 * k) and k does equal n/2, so it reduces the same way!
In short, I love combinatorics!
Who really won the World Cup?
Mood: geeky
Posted on 2010-07-11 16:22:00
Tags: soccer math
Words: 579
Congrats to Spain, although the final game was not super impressive.
Anyway, before the World Cup, I bought an ESPN magazine guide. It included "measures of success" for all 32 teams, so I thought it would be fun to see who did the best relative to their predictions.
Key:
HH = Happy to be Here = 0 points
OG = Out of Group stage = 1 point
QF = QuarterFinal = 2 points
SF = SemiFinal = 3 points
F = Final = 4 points
W = Win it all = 5 points
(note that the score = 5 - log_2(# of teams left at that stage))
So, without further adieu: (mouseover flag for country name)
| Group | Success | Actual | Difference | |
|---|---|---|---|---|
 | E | SF | F | +1 |
 | A | QF | SF | +1 |
 | F | OG | QF | +1 |
 | E | HH | OG | +1 |
 | F | HH | OG | +1 |
 | H | W | W | 0 |
 | D | SF | SF | 0 |
 | D | QF | QF | 0 |
 | H | OG | OG | 0 |
 | B | OG | OG | 0 |
 | C | OG | OG | 0 |
 | B | HH | HH | 0 |
 | H | HH | HH | 0 |
 | F | HH | HH | 0 |
 | G | HH | HH | 0 |
 | C | HH | HH | 0 |
 | C | OG | HH | -1 |
 | E | OG | HH | -1 |
 | A | OG | HH | -1 |
 | D | OG | HH | -1 |
 | H | OG | HH | -1 |
 | C | SF | OG | -2 |
 | A | SF | OG | -2 |
 | G | SF | OG | -2 |
 | D | QF | HH | -2 |
 | E | QF | HH | -2 |
 | A | QF | HH | -2 |
 | B | QF | HH | -2 |
 | B | W | QF | -3 |
 | G | W | QF | -3 |
 | F | SF | HH | -3 |
 | G | SF | HH | -3 |
| Group | Total success | Total actual | Difference |
|---|---|---|---|
| E | 6 | 5 | -1 |
| F | 4 | 3 | -1 |
| D | 8 | 6 | -2 |
| H | 7 | 5 | -2 |
| C | 5 | 2 | -3 |
| A | 8 | 4 | -4 |
| B | 8 | 3 | -5 |
| G | 11 | 3 | -8 |
| Total | 57 | 31 | -26 |
| Continent | # of teams | Total success (avg) | Total actual (avg) | Difference (avg) |
|---|---|---|---|---|
| Asia/Australia | 5 | 3 (0.60) | 2 (0.40) | -1 (-0.20) |
| North America | 3 | 4 (1.33) | 2 (0.67) | -2 (-0.67) |
| Europe | 13 | 25 (1.92) | 15 (1.15) | -10 (-0.77) |
| South America | 5 | 14 (2.80) | 10 (2.00) | -4 (-0.80) |
| Africa | 6 | 11 (1.83) | 2 (0.33) | -9 (-0.81) |
home energy usage - new shiny graphs!
Mood: geeky
Posted on 2010-07-06 11:09:00
Tags: projects
Words: 163
I've been wanting to play around with Tableau Public, so I decided to revamp my home energy usage graph.
Anyway, the new version is here, and I think it does a good job of showing the difference that having someone upstairs during the day makes, as well as the new A/C unit we bought a few months ago. I used a quadratic fit which seems to fit the data much better than the linear one I used before (you can mouseover the trend lines to see the equations!). Now I just need to wait to get some more data points!
You can click on points in either graph to see the corresponding one in the other, and Tableau makes it easy to download the raw data I used. If you select "True" for "Upstairs during day?" you can really see the effect of the new A/C. (green points vs. orange)
Thanks to Robert Morton for his help in getting it up and running!
home energy usage vs. temperature
Mood: geeky
Posted on 2009-11-09 12:48:00
Tags: math projects
Words: 62
I couldn't sleep last night so I whipped up this analysis of our home energy usage vs. temperature. It turns out that (spoiler!) we use more energy when it's hot outside. But I got to run my first linear regression!
People who know about statistics: feel free to criticize/suggest improvements. (I'm not even sure I was looking at the right R-squared value...)
Optimizing iTunesAnalysis through smarter parsing
Mood: geeky
Posted on 2009-07-08 10:31:00
Tags: optimization essay projects programming
Words: 631
The first in an occasional series
Intro: A while back I wrote a script to analyze an iTunes library and find your favorite artists, albums, etc. It works pretty well and I regularly use it to update my own analysis. Unfortunately, it generally takes a long time to run, which is sort of OK for me (because I just start it running and go do something else) but less good for people who are running the analysis through the web site.
So I'd like to make it run faster, and I have a number of ideas to do so.
Idea: There are two main parts to the system - parsing the iTunes Music Library.xml file into a database, and running the analysis on the database. First I'm focusing on the parsing part.
The first version of the parsing script uses Python's xml.dom.minidom package to completely parse the library file.
After profiling the first version by running python -m cProfile -o profiledata.oldway iTunesInfo.py "iTunes Music Library.xml", I see that the whole parsing process takes 114 seconds. The major parts of this are 60 seconds for the xml.dom.minidom.parse method and 46 seconds for the database operations. Note that this only leaves ~8 seconds for figuring out the track information - clearly this is not the bottleneck!
So I'd like to improve parsing speed. There are two basic kinds of XML parsers - what we're using now is a DOM or Document Object Model-style parser, which means that the parser reads the entire file in and returns a parsed structure containing all the data. (I remember writing a simple XML parser that did this as a project in COMP 314. Ah, memories...) The advantage to this method is that after the parsing is done, it's easy to traverse the DOM tree and find the data that you're interested in. The downside is that, well, it's slow. Also, the entire document has to be read into memory which means that your memory usage is proportional to the size of the file you're processing, which adds to the slowness and can lead to out of memory problems on huge files (although we weren't seeing that here).
The other basic kind of XML parser is known as SAX, or Simple API for XML. You provide callback functions that are called whenever the parser runs across the start of a tag, end of a tag, character data, and...that's it. Whatever processing you want to do you have to do in those callback functions. So if you're just, say, counting the number of <key> tags in a document this works really well. It's also much faster than the DOM-style parser, since it doesn't have to generate a giant tree structure. But doing the sorts of processing we're doing on the library file seems a bit more tricky.
Anyway, I take a stab at it, and after a bit end up with version 2 of the script. Notice that the logic in the Handler class is a bit twisted - we have to keep track of where we are in the document (so if things get out of order we'll have problems) and use a state-based system which is a bit brittle and unclear.
But how does it perform? The old version of the script ran in 114 seconds, and this version runs in 71 seconds for a ~60% increase in speed. But really, it's better than that, because the database operations still take around 50 seconds - if we subtract that from both we get 64 seconds versus 21 seconds which is a ~200% increase in the speed of the parsing.
Conclusion: This was a big success! Most of the time is now in the database layer, which I have some ideas for speeding up next time.
Source files:
- old script
- new script
better living through science
Mood: geeky
Music: that "Jai Ho" song
Posted on 2009-06-12 15:32:00
Tags: essay links
Words: 218
A while back I wrote a script to analyze our GnuCash account. A few months ago, I added a quick little feature to predict how much money we're going to spend this month - basically just taking the existing values and extrapolating to the end of the month, disregarding stuff that is largely the same like the mortgage payment and bills. So every time I run the script I get an updated projection of how much money we'll spend this month.
For something so simple, it's surprising how it's changed my behavior. I'm very much more conscious about spending money now, and last month we spent the least amount we have in a while. Of course, that's just one data point. It's similar as the idea behind the Google PowerMeter - if you can measure something well you're more likely to think about it more and conserve when you can.
In a similar vein, the Wall Street Journal writes about not getting enough sleep and a device called the Zeo which tells you how well you slept the next morning. Again, the idea is that you can try out different things (cutting out caffeine longer before bedtime, etc.) and see how they affect your sleep patterns. Cool stuff! Yet another study shows that sleep is important and helps you learn.
a slight geek-out
Mood: geeky
Posted on 2009-02-17 14:26:00
Tags: referrer
Words: 42
qwantz (the guy who writes Dinosaur Comics, which is awesome and you should totally read) just linked to me! (for finding an article he remembered)
I think I have now extracted all the joy possible out of this moment. Back to work...
$1 coins take two
Mood: geeky
Posted on 2008-12-08 17:11:00
Tags: dollarcoins
Words: 51
As a followup to my last entry, I did an experiment on the work vending machines today. I am happy (and surprised) to report that both the candy and the soda machine happily took my dollar coin. Oddly enough, when I hit coin return they both gave me back four quarters!
"I wish I had done this!"
Mood: geeky
Posted on 2008-11-26 10:16:00
Tags: essay math programming links
Words: 387
"I wish I had done this!" is my highest praise for a website. The last time I can remember using it was for wowjutsu, which tracks raid progression in WoW by looking up what gear people are wearing in the Armory and matching that with where that gear came from. Simple idea, useful, interesting, but the technology behind it is something I totally could have done.
My newest "I wish I had done this!" is StateStats. You enter a search term, it finds which states in the US search for that term more per capita, then gives you a nice heat map of the US. But then it correlates that with a host of other state rankings: obesity, income, high school graduation rates, voted for bush, percent youth, etc., etc., etc. So you can see that searches for "prius" are correlated with income and negatively correlated with energy consumption. Or searches for "gay" are correlated with density (i.e. more urban states) and negatively correlated with voted for bush. Or searches for "lsu" are highly correlated with, well, being Louisiana. Or searches for "coke" are highly correlated with obesity, while searches for "soda" are highly negatively correlated with obesity. (huh?) Or searches for "tea" are correlated with income and negatively correlated with voted for bush.
Anyway, it's a ton of fun to play with, and the example queries ("garth brooks" is highly correlated with voted for bush!) are interesting, but it's even more fun to think of a common search term and see what pops up.
The correlation metric it's using is just based on rank and not intensity - i.e. it's just the order of the 50 states that matter, not how much the first place one is bigger than the second place one. This probably leads to some false positives when the numbers are very close together. Also, I'd imagine there's a natural inaccuracy determining which state a particular query is coming from, and since you're looking at things only on a state by state level (as opposed to county by county or something) it's not as precise as it theoretically could be.
And don't forget correlation is not causation - searching for "hockey" does not make it colder outside, or make you richer.
I award StateStats the official "I wish I had done this!" seal of approval.
Firefox 3 approaches!
Mood: geeky
Posted on 2008-06-12 13:58:00
Words: 37
Firefox 3 will be released on Tuesday. If you haven't tried the betas, it uses up noticeably less memory than Firefox 2 and is a lot more stable. Here's a broad overview of new features. I'm pumped!
possibly the coolest shirt ever
Mood: geeky
Posted on 2007-10-08 16:08:00
Words: 3
Theorycrafting: calculating my DPS
Mood: geeky
Posted on 2007-09-13 10:00:00
Tags: math theorycraft worldofwarcraft
Words: 220
So I whipped up a little DPS calculator which is unfortunately specific to my talent build. Anyway, it's fun to play with. (for me; results may vary if you're someone else) My current numbers are +644 frost dmg, +598 fire dmg, 524 intellect, 222 crit rating, 83 hit rating. This gives me DPS on my frostbolt/fireblast/total as 621/675/630. For fun, what happens if I replace my gear with gear from Kara? (assuming I get all the same enchants)
| Gear | frostbolt/fireblast/total DPS |
|---|---|
| Current | 621/675/630 |
| Harbringer Bands | 622/675/631 |
| Handwraps of Flowing Thought | 619/687/630 |
| Brooch of Unquenchable Fury | 624/678/633 |
| Nethershard Girdle | 617/668/626 |
| Shadow-Cloak of Dalaran | 624/676/632 |
| Bands of Nefarious Deeds | 625/677/634 |
| Gloves of the Aldor (T4) | 620/687/632 |
| Staff of Infinite Mysteries | 639/688/647 |
| Malefic Girdle | 622/671/631 |
| The Lightning Capacitor | hahaha I have no idea |
| Tirisfal Wand of Ascendancy | 626/680/635 |
| Jewel of Infinite Possibilities | 630/685/639 |
| Uni-Mind Headdress | 636/688/644 |
Theorycrafting: spell hit rating and me
Mood: geeky
Posted on 2007-09-12 15:48:00
Tags: math theorycraft worldofwarcraft
Words: 352
Last night some gear dropped in Kara and I was next on the unofficial Suicide Kings list for loot and I couldn't decide whether to take it or not because of stupid spell hit rating. So I'm going to work out how much spell hit rating is useful for me in the hope of avoiding this in the future. This is all based on the Spell hit article in WoWWiki.
For raiding, bosses are considered to be level 73, which means by default I have a 83% chance to hit them with spells. I have 3/3 points in Elemental Precision which gives me +3% hit for Frost and Fire spells (which is all I ever cast on bosses), bringing me to 86%. The maximum hit chance possible is 99%, so that leaves a 13% gap.
1% of spell hit chance is the same as 12.6 points of spell hit at level 70, so that means I need 13*12.6=163.8 spell hit rating to max out. Since I have 5/5 points in Ice Shards, my frost spells crit bonus is 100%. Unlike melee attacks, for spells hit and crit are separate rolls. So 1% of spell crit chance is really worth (chance to hit)%. So spell hit does more good than spell crit. (for fire spells spell hit is even better, since by default the crit bonus is only 50%) It takes 22.1 spell crit rating to get 1% of spell crit chance at level 70.
Summary: I only have 83 spell hit rating with my current gear, so I need another 80 spell hit rating to max that out. When comparing gear, since my current spell hit chance is 92.6%, 1 point of spell hit is worth around (22.1/12.6)/(.926)=1.9 points of spell crit, and this is underestimating spell hit since I do cast fire spells in my normal rotation (frostbolt, frostbolt, fire blast, ...) Also, spell hit is worthless on my PvP gear since my chance to hit is 96%+3%=99% on lvl 70 opponents, which is maxed out.
Next time, how much spell hit/crit is worth versus +spell damage!
Thanks to destroyerj for corrections.
camping, facebook
Mood: geeky
Posted on 2007-06-11 12:27:00
Tags: facebook programming
Words: 232
This weekend blamantin and Alex and djedi went camping. It was, in a word, fun! We hiked on a trail in Rocky Gap State Park (in western MD) that was 4.5 miles - quite a good workout! After swimming in the lake, We drove to some campgrounds and played games, roasted marshmallows (mmmmmmmm), etc. We had been a little worried about the weather, as there was a chance of rain, but the weather for the hike was pretty darn good, felt around 80 degrees or so. It ended up being pretty cold at night - luckily djedi and I had brought sweaters so we wore them to bed and huddled together to conserve heat, which worked decently well :-) I took a bunch of pictures that I'll put up soon.
I'm planning on writing a Facebook application as my next project. My thought was to make a "friend of a friend" sort of thing, like LiveJournal has (but you have to be paid or maybe plus to see it - sorry!) which shows people that lots of your friends have friended but you haven't. It seems like a good way to discover people on Facebook that you didn't realize were there, or people that you might be interested in meeting :-) Anyway, for various technical reasons step 1 is to upgrade my Apache web server from 1.3 to 2.0, so hopefully I can make that work tonight.
I like charts
Mood: geeky
Posted on 2007-03-09 14:40:00
Tags: links
Words: 33
The top 100 Wikipedia pages viewed in March. Heroes is more popular than many sex-related terms!
The top programming languages by number of posts to their comp.lang.* newsgroup. LabVIEW is #10! (via waxy)
This backup was done by LJBackup.